Tag Maps Python implementation: TU Dresden Emoji Clustering
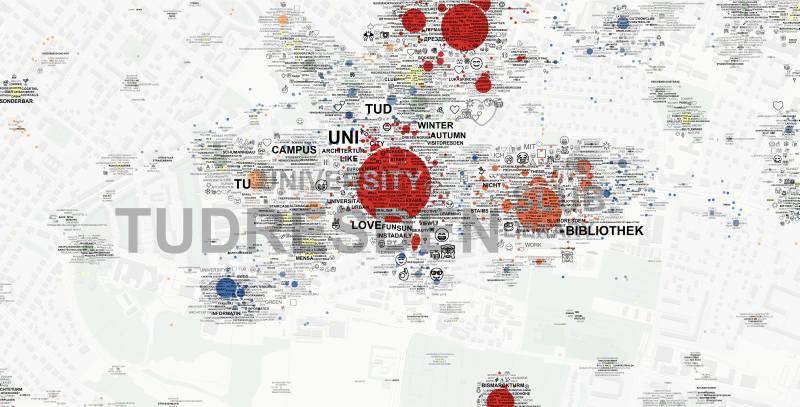
As part of our ongoing research on spatio-temporal clustering of Social Media post’s metadata (locations and tags), we made a significant step forward by implementing the original code in Python (the project is publicly available in our VGIscience Git Repository). The tool now uses an adapted version of HDBSCAN single-linkage implementation, which is not only faster but also more stable for larger datasets. As a side effect of using Python, it is now possible to cluster rare Unicode characters such as emoji. The map shown below, for the TU Dresden Campus area, is based on both Flickr and Instagram photo location and tag clustering. Emoji that appeared in geotagged posts were used to generate an additional set of information. These were processed equally to the clustering of tags. However, Emoji clustering is done in a separate step, both sets are normalized to the same range of weights and layers are only merged at the end for visualisation. This ensures that emoji have an equal chance to appear on the map, based on their respective importance in an area.
We submitted this map as a poster for the upcoming Workshop on “Methoden visueller Kommunikation in der räumlichen Planung” in Kassel (see full Poster PDF with description). But the map is also a base for the currently ongoing Open Space Redesign of the TU Dresden Campus. Next to the more traditional data source, these maps help planners to understand the public’s perception of an area. While the Flickr and Instagram data is certainly not universally representative, it portrays an image of the environment that is held by a specific group of people: students and younger people who are active on these platforms. These groups are usually those who are not very active in common approaches to citizen participation. Therefore, taking user-generated social media content into account in planning processes and Open Space Design can support a more equal, balanced (or fairer) consideration of different and diverse groups of interest.
On the TU Dresden Emoji-Tag-Map, one can see the major areas of activity: Between the central Campus area around the Hörsaalzentrum to the SLUB, Saxon’s State and University Library. The most used emojis on the campus are 🎓 [Graduation Cap emoji] and 📚 [Books emoji]. These central areas of activity are surrounded by satellites of other centers of activity. For example, the relatively new Informatics Faculty Building is lively visible in people’s references and emoji (characteristic in this area: 🤖 [Robot emoji] and 🤓 [Nerd Face Emoji]). Overall, emoji and tags supplement each other surprisingly good. We can see localized activities in parks, such the Beutlerpark, being reflected in emojis such as ☀ (sunbathing?), 🍂 [Fallen Leaf] or 🍁 [Maple leaf] (enjoying autumn?) and tags such as “FAHRRAD” or “SPIELPLATZ”. In other areas, references are visible to the regular counter racism demonstrations on February 13 (“demonstration”, “nazifrei”, “demo”). In still others we can see references to student live and leisure activities.
There’s a series of upcoming Workshops where we will talk about the new Tag Maps process [February: Kassel, Germany (Regional Planning); March: Virginia Charlottesville, USA (Architecture & Urban Planning) and Leibniz Institut für Länderkunde in Leipzig (Regional Geography Science)]. We hope that these workshops support a wider application of this visualisation technique, especially in practice oriented fields such as Landscape & Urban Planning.
